
Smart Cities Mission of the Government is a bold, new initiative. It is meant to set examples that can be replicated both within and outside the Smart City, catalyzing the creation of similar Smart Cities in various regions and parts of the country. The core infrastructure elements in a smart city would include:
- Adequate water supply,
- Assured electricity supply,
- Sanitation, including solid waste management,
- Efficient urban mobility and public transport,
- Affordable housing, especially for the poor,
- Robust IT connectivity and digitalization,
- Good governance, especially e-Governance and citizen participation,
- Sustainable environment,
- Safety and security of citizens (particularly women), children and the elderly,
- Health and Education.
Smart Cities Mission is an urban renewal and retrofitting program by the Government of India with a mission to develop 100 cities (the target has been revised to 109 cities) all over the country making them citizen friendly and sustainable. The Union Ministry of Urban Development is responsible for implementing the mission in collaboration with the state governments of the respective cities. The Government of India under the honorable Prime Minister Shri Narendra Modi has a vision of developing 100 smart cities as satellite towns of larger cities by modernizing the existing mid-sized cities. The focus is on sustainable and inclusive development and the idea is to look at compact areas, create a replicable model which will act as a lighthouse to other aspiring cities.
boost by the government will benefit companies in sectors associated with such amenities. However, it would be some time before the project related work starts reflecting in the numbers of these firms, given that it is yet to take off the ground. Investors need to take at least 3 to 5 year’s perspective while investing in any of the names.
Here are some stocks that could emerge winners from the Smart City push
The most tangible theme emerging from the Smart City mission is the thrust on affordable housing. Additionally, the entire housing sector will be further bolstered by the ‘Housing for All’ initiative, also called the Pradhan Mantri Awas Yojana, through which the central government seeks to build 2 crore homes for the urban poor by 2022. Given the demonetization drive, housing prices will decline for shorter term (restricted to 1-2 years) which will generate good buying opportunities for long-term investments.
Any boom in the housing space is likely to benefit companies operating in its proxy sectors. Prominent among them are companies in cement, paints, electrical and piping segments. For cement manufacturers, the sharp correction in coal and crude oil prices (key ingredients in cement manufacturing) offers potential for expansion in operating margins in coming months. While big players like ACC, Ultra Tech Cement and Ambuja Cements are well placed to ride the demand scenario, some of the mid-sized cement firms operating in South India are doing particularly well, on the back of a pickup in construction activity and rising cement prices in the region. Shares of Ramco Cements, Deccan Cements, and Sagar Cements surged of late, but present good buying opportunity after the recent correction. Cement prices have sustained at higher levels in the southern region for past one year and alleviate our concern of erosion of pricing power of cement manufacturers in the region.
The demand for lighting, switchgear, and other electrical equipment will also get a boost from the uptick in construction. Firms like Bajaj Electricals, Havells India, Crompton Greaves and Lloyds electrical are among the established players in this space.
Among them, Bajaj Electricals is a candidate for re-rating after a turnaround in its project business. Bajaj Electricals being a strong brand is well positioned to reap the benefits of a revival of the Indian economy, growing urbanization and lower penetration of appliances. Lloyd’s electric looks bullish despite the demonetization policy as noted by their management interview.
Highlights from Lloyds electric and engineering management interview:
- They don’t see much any de-growth because of demonetization.
- On the contrary, see around 5-10% growth in the upcoming quarters.
- Launching a credit scheme along with Bajaj finance where one can pay Re. 1 and get possession of the consumer durable and remaining amount one can pay in 2017.
Hence, this move is expected to negate the demonetization effects.
The benefits from the boom will extend to the housing finance players
Once construction activity takes off, the demand for housing loans will be on the higher side, which will particularly benefit smaller NBFCs like Gruh Finance, Repco Home Finance, and CanFin Homes. A sizeable portion of the loan books of these companies comprises the affordable housing segment. However, demand for housing loans will remain muted for next few quarters because of demonetization. However, low-interest rates in future and Public-private partnerships (PPP) will drive demand for housing loans in the future.
The government’s emphasis on sanitation and hygiene will also create a healthy demand for companies in the sanitaryware, waste management, and water treatment space. Cera Sanitaryware and Kajaria Ceramics are among the leading players in the sanitaryware segment.
Water treatment solutions provider VA Tech will be a direct beneficiary of the Smart City initiative, being a dominant player in this business. Being involved in the ongoing National Rural Drinking Water program for providing safe drinking water will go a long way in helping it bag orders for the Smart City project.
Let’s discuss the Technical aspects in a couple of stocks which will be in focus with the development in Smart cities:
CERA SANITYWARE

The weekly chart of CERA shows that Stock witnessed a strong decline in last three weeks from 2750 to 1853 levels. The decline has led price to drop at 61.8% retracement levels and seen holding near the same from last week. 100 EMA also collides near same support adding more reliability of the support to hold in near future. If price fails to trigger fresh buying momentum and breaks the support next support is seen near 1750-1770 levels which are 78.6% retracement levels of its previous upswing. Momentum indicator RSI has moved back higher again above 40 levels which are a bullish signal. Stock continue to move higher from this levels stock has small hurdle towards 2270 levels and crossing above next key resistance is seen near 2530-2550 levels.
KAJARIA CERAMIC

The weekly chart of Kajaria Ceramic shows that stock has been a strong uptrend. The stock has formed successive higher highs and lower highs formations which clearly shows the presence of bulls holding the grip. However, from last two months, the stock has witnessed strong profit booking which is viable as the stock has given outstanding returns to investors. The decline has led price to drop to the long term 100 EMA which also collides with 61.8% retracement levels of its previous advance. Recently near the support the stock has twin Doji candle pattern and with strong follow up has been witnessed confirming strong support for the price and likely to hold in near future. The key support for the stock is 440 levels where we find long Upward sloping trend-line support is placed which is drawn connecting troughs. On the higher side, 580-590 can act as resistance in near term which is 50% retracement zone of its previous decline.
VA TECH WABAG

The weekly chart of VA Tech shows that after witnessing vertical rally from the year 2013-2015 stock experienced a profit book post making lifetime highs of 972 in March 2015. The decline has led price approached the 61.8% retracement level of its whole up move. Price has also taken support at 61.8% retracement a few months back and seen decent gains from support. Up move in price got arrested near falling trend line resistance which is drawn connecting swing peaks. Post witnessing decline from resistance recently price again hold near 61.8% retracement levels and has been sustaining which is a positive signal. Hence if price continues to hold support and gains buying momentum we can expect the stock to rally towards declining trend-line which comes around 550-570 levels. Breaking this trend line resistance we can expect a change in trend from downside to up thus this stock should be kept in radar for an investment purpose. However, price fails to materialize ahead 410-420 can act as support and below that 348-356 can act as strong support which is 78.6% retracement levels of its previous rally.
ACC

After a strong rise seen since the start of the year, Stock retraced quite swiftly as can be noted from the weekly charts. The steady decline that emerged has now retraced into the 78.6% Fibonacci supports indicating that the steady decline that we observed is now arrested and could attempt a recovery. Momentum indicators are also indicating that the prices had reached deeply oversold levels and are due for a rebound. However, the prices continue to be restricted by the median line of the down sloping Pitchfork and sustained closing below it suggest that the overall trend remains pressured threatening to breach the supports. However, the downside is limited to 2016 low around 1180.
ULTRATECH CEMENT

Compared to its peers Ultratech Cement is on a much firmer wicket. Weekly charts indicate that the reaction seen over the past few weeks have seen the prices reacting from a strong value area region around 3400 where the previous highs managed to arrest the fall. Further, a Fibonacci retracement of the entire rise seen since the start of the year coincided with the same levels thus indicating that the revival is around the bend. Momentum indicators are also reviving after some healthy correction to the up trend. The steady demand has been generated at lower levels suggests that possibility of prices retesting the high of 4000 levels in the near term. All this depends on the developments of Smart City initiative gathering momentum.
AMBUJA CEMENT

Correction in this stock has been quite severe. Higher time-frame charts indicate that the lows of the year were tested and the rally that ensued in the last two weeks have been more of short covering in nature. A down sloping Pitchfork drawn on the charts highlights the resistance that is at present holding the rebound. Overall market conditions are not helping the prices stage a recovery. A relief for the prices does present itself in the form of an oversold rebound as RSI had never stepped into this territory in the past three years. A move above the median line has got the potential to raise up to its next resistance zone around 245 levels.
BAJAJ ELECTRICALS

The stock is trading at 61.8% retracement of the recent advance where some recovery is seen. The recovery is more likely to be considered as a pullback from lower levels as RSI in lower time frame hits deeply oversold zone. The stock is expected to continue on sideways action couple of more days and complete the second leg of correction to lower levels. RSI, as seen on the weekly time frame, trades below 40 levels while DI- line above neutral zone together indicates bearishness to persist. The correction is expected to continue towards 160 levels where long-term support trend line is placed and is the strong demand zone. On the other hand, Intermediate halts seen near 182-185 levels will be key levels to watch. Continuation of the recovery above 235 levels will lead price to resume the medium term uptrend towards 275-280 levels.
HAVELLS INDIA
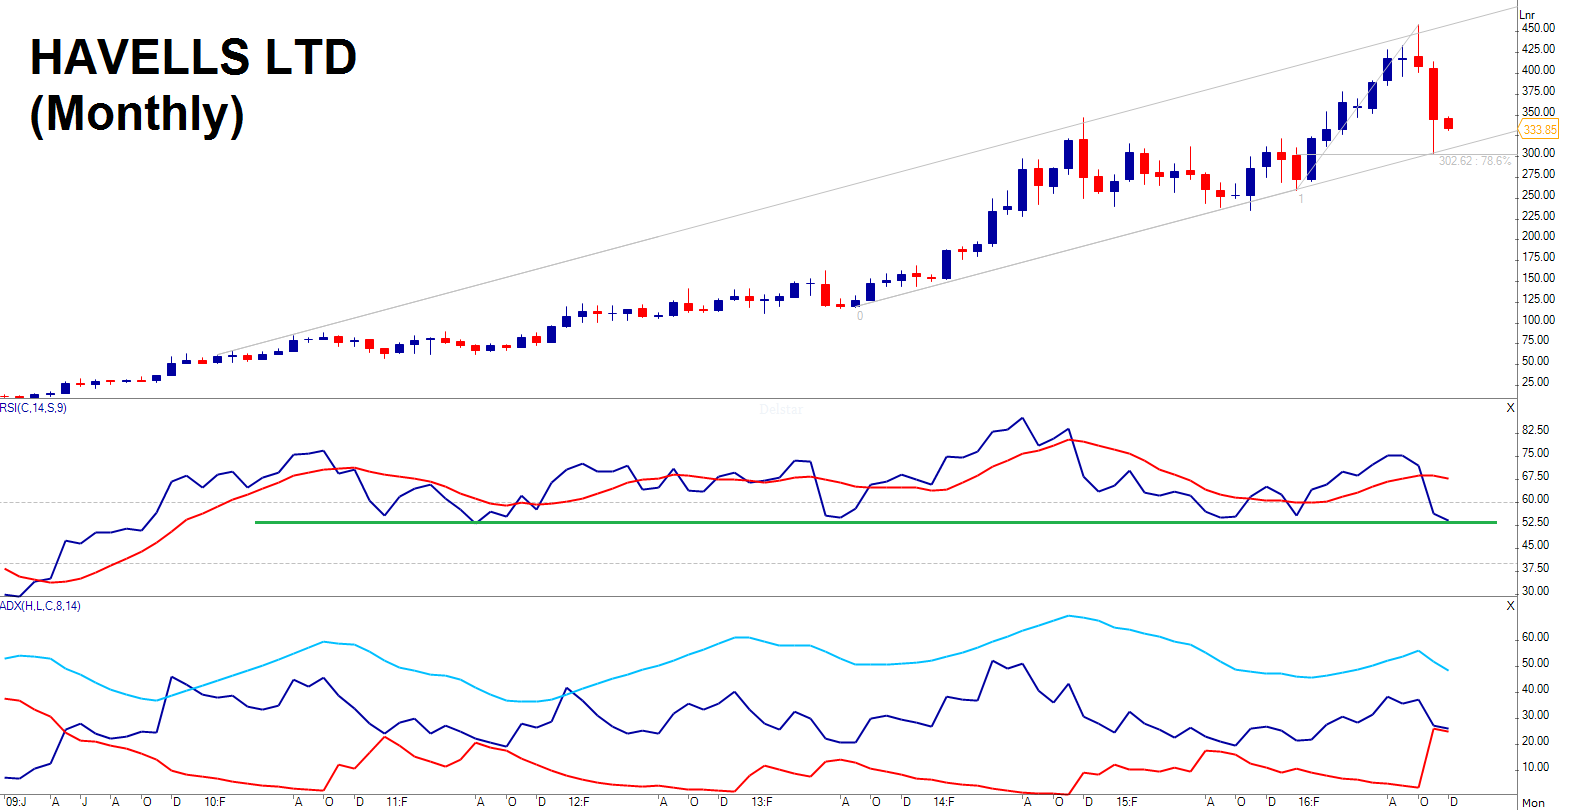
The stock has been quite on the upside rally and moved from 125 levels to all-time highs of 460 in a matter of 3 years (4x rise). The stock is seen following in tight uprising parallel channel where the instance is too low to be followed by has acted well as supports and resistances. The recent fall in stock price was arrested at 78.6% retracement of the recent advance and the lower end of the parallel channel. Well, this is more of concern where the initial leg of correction has breached below the previous peak and the rise is expected to halt while the second leg to continue towards lower levels. RSI has been consistent at 52 levels with DI+ line dominating the overall trend. If the breach down in price happens, momentum could see a range shift towards lower levels.
LLOYDS ELECTRICALS & ENGINEERING

Stock witnessed a good rally in the recent past where the move from 25 levels to 330 was printed. This 13x move was halted at 127.2% retracement of the previous decline followed by correction and couple of periods ranged move. Price saw attempting to register fresh all-time highs was arrested near the same levels and seen dropping towards the longer term trend-line where the previous peak acted as strong support. Volumes at the new highs were robust indicating fresh positions add up with short term traders more into involvement. Momentum indicators seen easing without major damage on larger time frame chart shows price recovery to new highs is expected. The long term support trendline placed at around 235-240 levels where the previous peak has also been cited will boost the momentum and recovery in price will be visible.


Thanks, great article.